


Table of contents
Hello Learners , you guys are doing really a good job. You will not be there 24*7 to monitor your resources. So, Today let’s monitor the resources in a smart way with - Grafana 🎉
Task 1:
What is Grafana? What are the features of Grafana? Why Grafana? What type of monitoring can be done via Grafana? What databases work with Grafana? What are metrics and visualizations in Grafana? What is the difference between Grafana vs Prometheus?
What is Grafana?
Grafana is an open-source data visualization and monitoring tool that allows you to query, visualize, alert on, and understand your metrics no matter where they are stored. It supports a wide range of data sources, including popular databases like MySQL, PostgreSQL, and Prometheus.
Grafana connects with every possible data source such as Graphite, Prometheus, Influx DB, ElasticSearch, MySQL, PostgreSQL etc. The open-source nature of the solution helps us alternatively write custom plugins to connect with any data source of our choice.
What are the features of Grafana?
Dashboard templating. One of Grafana’s most important functions, dashboard templating helps you to build dashboards that can be reused for different purposes and shared among your organization’s teams.
Provisioning. While it’s easy to construct a single dashboard by clicking, dragging, and dropping, users who need a lot of dashboards will want to use a script to automate the process. Grafana allows you to script anything and get control of a large number of dashboards.
Annotations. In Grafana, this feature appears as a graph marker and is useful for correlating data in case something goes wrong. You can either manually generate annotations (control-click on a graph and type some text) or fetch data from any data source.
Kiosk mode and playlists. If you want to display your Grafana dashboards on a TV monitor you can use the playlist function to choose which dashboards you need to look through and make them cycle through on the screen. In view-only mode, the kiosk mode hides all the user interface elements you don’t need.
Custom plugins. You can use plugins to extend Grafana and integrate it with other software, visualizations, and more. Anything that produces a timestamp and a value can be visualized in Grafana with just a few lines of code.
Alerting and alert hooks. If an anticipated scenario occurs, alerts are activated like tripwires. These events can be reported to the monitoring team through Slack or some other communication channel.
Permissions and teams. When a company has one Grafana and several teams, they often want to keep things apart while still sharing dashboards. If you’re using Grafana Enterprise, you can build a team of users and then set permissions on folders, dashboards, and down to the data source level.
SQL data sources. Grafana’s native SQL support allows you to turn anything in a SQL database into metric data that you can graph. SQL data sources are used by power users to do a variety of fascinating things, such as building business dashboards.
Authentication. Grafana supports a variety of authentication styles, including LDAP and OAuth, and lets you map users to organizations. You can also map users to teams in Grafana Enterprise: Grafana helps you to map the teams in your internal systems to Grafana teams if your organization has its own authentication system. As a result, you’ll be able to automatically grant access to the dashboards to employees that belong to particular teams.
Grafana benefits include:
Customizable dashboards are feature-rich and can be configured to display data from a wide range of databases using visualization tools such as heatmaps, histograms, and charts. The platform is flexible and easy to use.
Native support of a broad range of databases. Grafana is open source and provides the ability to create custom plugins based on project requirements.
Grafana is the ideal solution for dashboard development and visualization because cloud systems like AWS have built-in data collection infrastructure.
You can host it on-premises or on any cloud platform you choose.
Why Grafana?
Grafana is a popular choice for data visualization and monitoring due to its powerful and flexible dashboard editor, support for multiple data sources, variety of visualization options, alerting capabilities, user management features, and active community support
Grafana is used by businesses to track their infrastructure and log analytics and improve operational performance. Grafana dashboards facilitate the monitoring of users and events by automating the collection, management, and display of data. This information can be used by product managers, security analysts, and developers to guide their decisions.
It reveals to teams and businesses what their customers really do, not just what they claim to do. These are known to be revealed behaviors, and they are extremely informative. Users aren’t very good at foreseeing their own future, but having analytics helps tech teams to dig deeper than human-error-prone surveys and tracking.
What type of monitoring can be done via Grafana?
Infrastructure Monitoring: Grafana can be used for monitoring the health and performance of infrastructure components such as servers, databases, and networks.
Application Monitoring: Grafana can be used to monitor application performance metrics such as response time, error rates, and throughput.
Log Monitoring: Grafana can be used to analyze logs and create visualizations of log data to identify trends, patterns, and anomalies.
Cloud Monitoring: Monitoring cloud resources and services from providers like AWS and Azure.
Container Monitoring: Monitoring containerized environments, resource usage, and service availability.
Network Monitoring: Tracking network latency, bandwidth usage, and device performance.
What databases work with Grafana?
Grafana supports a variety of databases that can be used as data sources for visualization and monitoring. Some of the popular databases that work with Grafana include Prometheus, InfluxDB, Graphite, Elasticsearch, MySQL and PostgreSQL, Microsoft SQL Server, Cloud Provider Databases like Amazon Web Services (AWS) RDS, Google Cloud SQL, and Azure Database. It also works with other databases that include TimescaleDB, OpenTSDB, SQLite.
What are metrics and visualizations in Grafana?
Metrics tell you how much of something exists, such as how much memory a computer system has available or how many centimeters long a desktop is. In the case of Grafana, metrics are most useful when they are recorded repeatedly over time. This permits us to compare things like how running a program affects the availability of system resources.
Metrics like these are stored in a time series database (TSDB), like Prometheus, by recording a metric and pairing that entry with a time stamp. Each TSDB uses a slightly different data model, but all combine these two aspects and Grafana Cloud can accept their different metrics formats for visualization.
Visualize existing observability data:
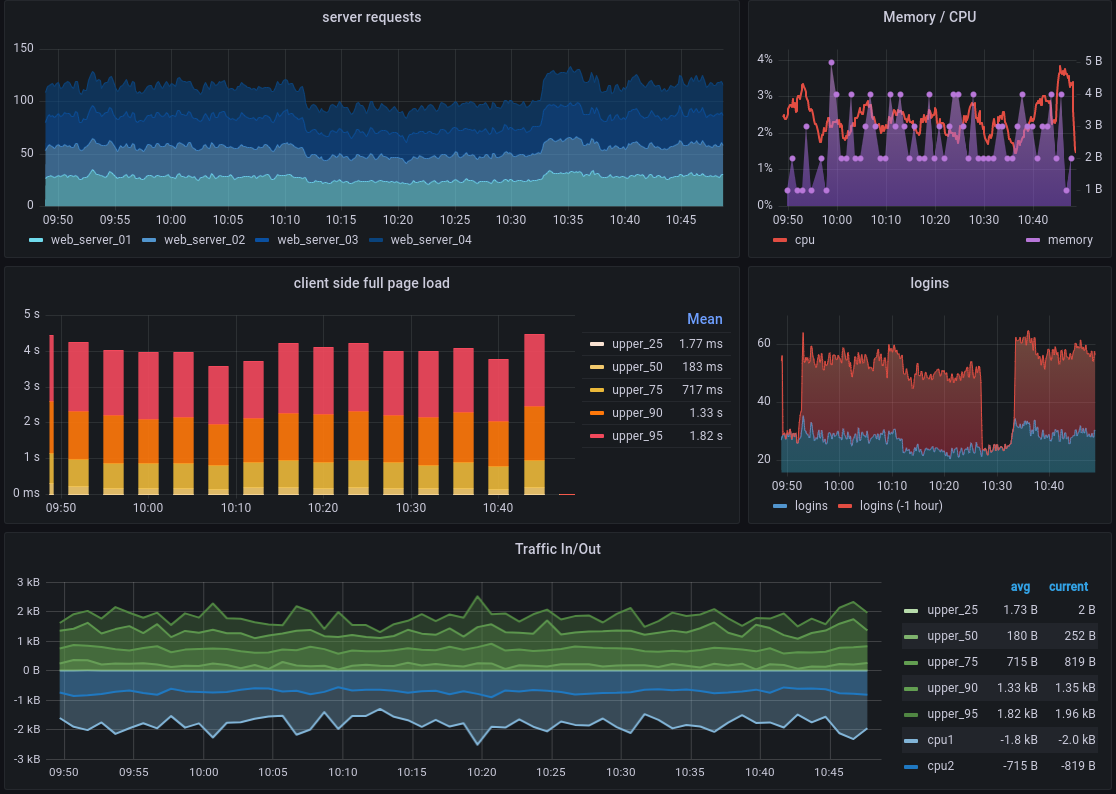
Visualizations are the graphical representations of these metrics, such as graphs, tables, and gauges.
Grafana Cloud runs the same open source Grafana platform deployed by thousands of DevOps and SREs, but is managed and optimized by Grafana maintainers and contributors, so you don’t have to worry about downtime, upgrades, and high-availability for your metrics visualization platform.
You can visualize observability metrics from existing data sources running in your environment and managed data endpoints built-in to Grafana Cloud.
Start visualizing
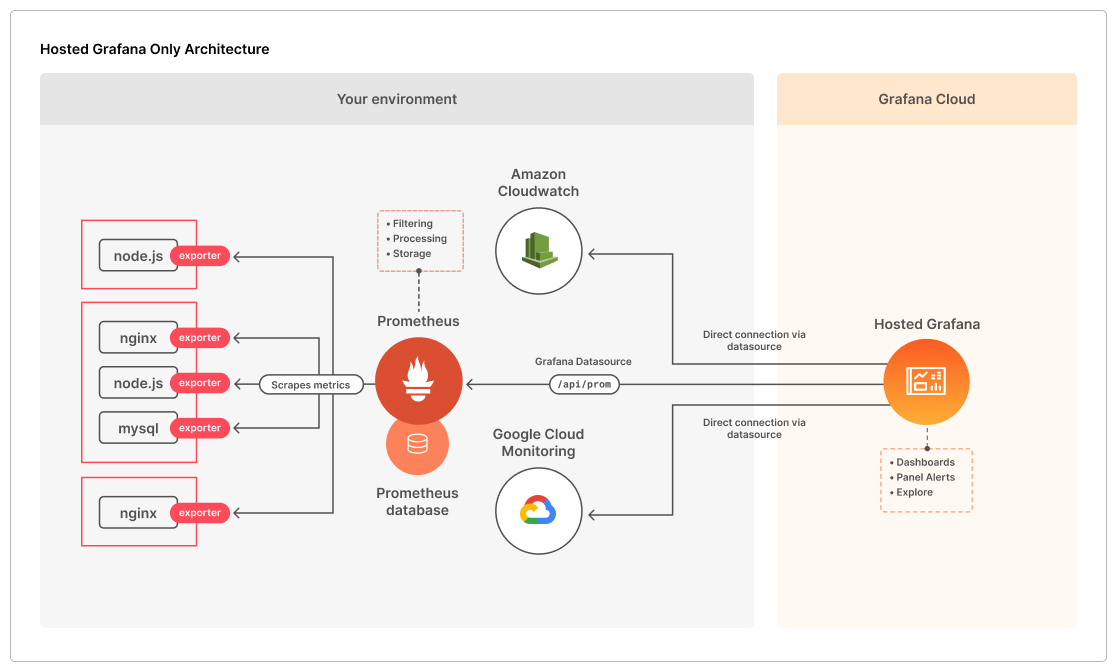
Plug in your data sources: Grafana natively supports many popular data sources like Prometheus, Elasticsearch, and Amazon CloudWatch, and offers plugins for many more. The Grafana plugin library contains over 40 data source plugins for many popular data stores, cloud services, and applications, all with one-click installation into Grafana Cloud. Integration with Grafana Cloud metrics and logs endpoints comes built-in and pre-configured. See the Grafana data sources documentation for details.
Import a Grafana dashboard: There are hundreds of official and community-built Grafana dashboards that you can import to get visibility into your apps and infrastructure. To learn how to import a dashboard into Grafana Cloud, please see Importing a Dashboard from the Grafana docs.
Explore your metrics data: Using PromQL, you can select and aggregate time series data in real time and visualize it in a graph or table. Grafana’s Explore view allows you to optimize and debug queries, as well as view metrics, logging, and tracing data side by side to dig into incidents and events. To learn more about using Grafana’s Explore view, please see Explore from the official Grafana docs.
Explore tracing data: Using TraceQL, a query language modeled on PromQL and LogQL, you can interactively extract insights from your trace data. You can use the Tempo data source Search and query editor to create TraceQL queries.
What is the difference between Grafana vs Prometheus?
Grafana or Prometheus: Which One is Better?
Breaking down complex data in an understandable manner will be the first choice for any organization.
Grafana, unlike Prometheus, provides maximum options of breaking down data into an understandable form.
With its feature of supporting multiple databases, it helps in creating a much better understanding of data.
Prometheus specializes in event monitoring and has very little to do with the visualization part. Even it has to be dependent on Grafana for better optimization of data.
With the above discussion, it becomes quite evident that Grafana would be a better option to opt for when it comes to doing complete justice with data.


linkdin:https://www.linkedin.com/in/gajanan-barure-7351a4140
Happy Learning :)
Keep learning,Keep growing🎇🎇
Thank you for reading!! Hope you find this helpful.
#day72#90daysofdevops#devopscommunity#