


Table of contents
- Task:
- Install Docker and start docker service on a Linux EC2 through USER DATA .
- Create 2 Docker containers and run any basic application on those containers (A simple todo app will work).
- Now intregrate the docker containers and share the real time logs with Grafana (Your Instance should be connected to Grafana and Docker plugin should be enabled on grafana).
- Check the logs or docker container name on Grafana UI.
- Install node_exporter
We have monitored ,😉 that you guys are understanding and doing amazing with monitoring tool. 👌
Today, make it little bit more complex but interesting 😍 and let's add one more Project 🔥 to your resume.
Task:
Install Docker and start docker service on a Linux EC2 through USER DATA .
Create 2 Docker containers and run any basic application on those containers (A simple todo app will work).
Now intregrate the docker containers and share the real time logs with Grafana (Your Instance should be connected to Grafana and Docker plugin should be enabled on grafana).
Check the logs or docker container name on Grafana UI.
For Grafana installation:refer my previous blog74.
Launch an EC2 instance

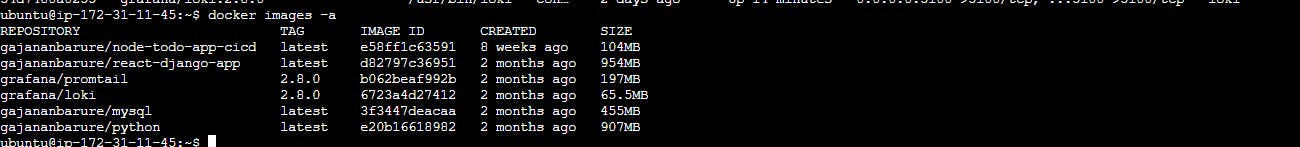
Created containers by using images
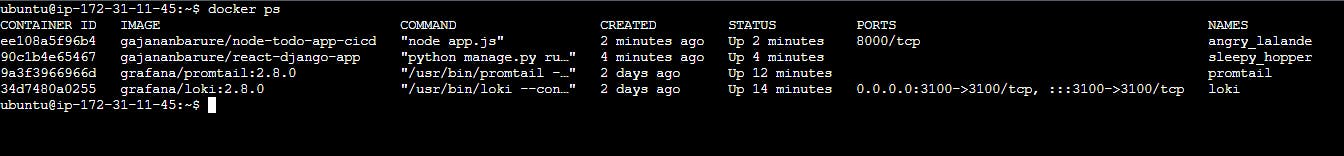
check status of docker containers
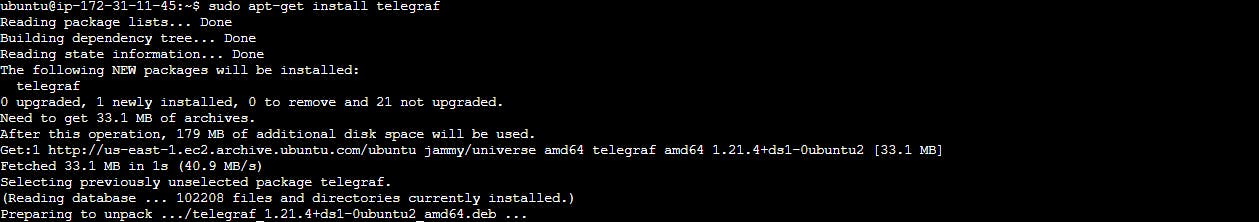
ubuntu@ip-172-31-11-45:~$ sudo apt-get install telegraf
Telegraf is a server-based agent for collecting and sending all metrics and events from databases, systems, and IoT sensors. Telegraf is written in Go and compiles into a single binary with no external dependencies, and requires a very minimal memory footprint.
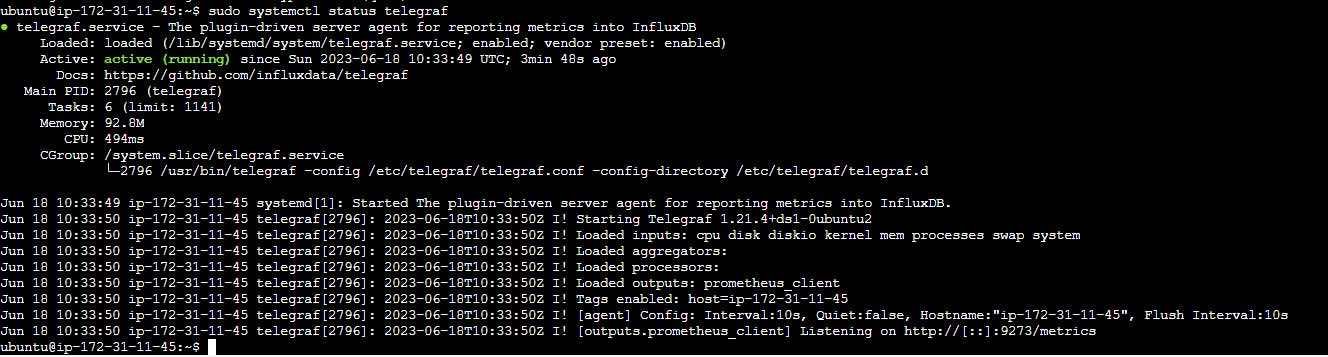
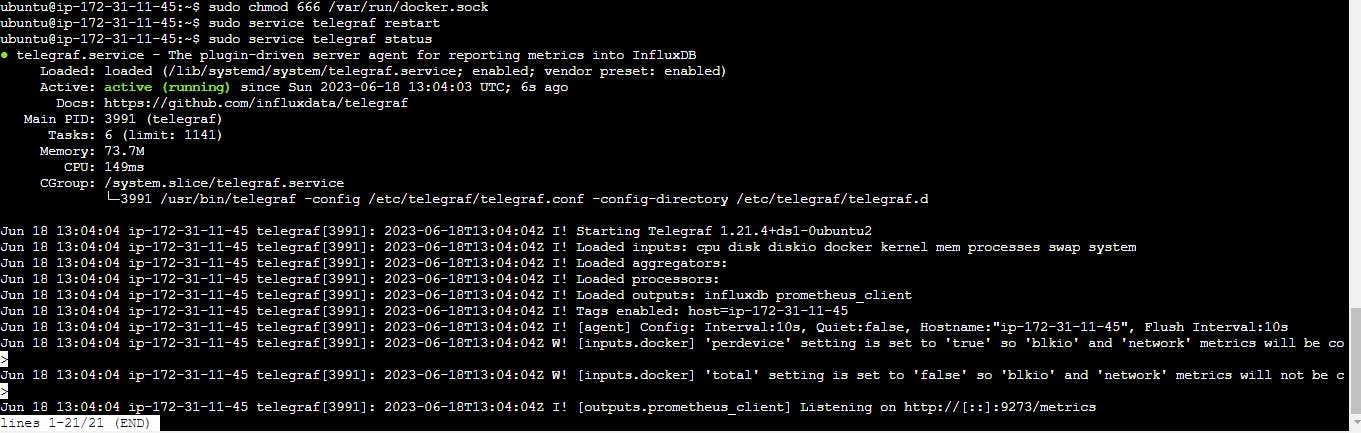
check the status of telegraf running or not
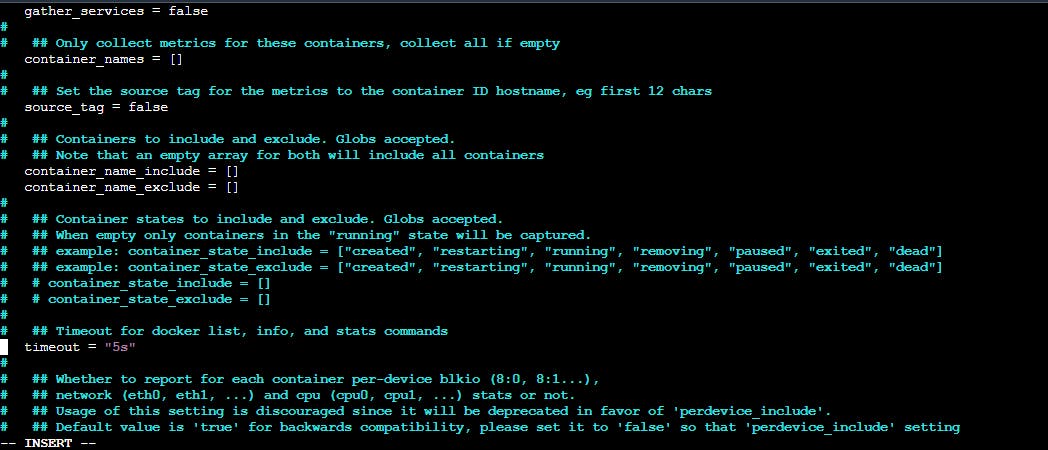
change the telegraf configuration file to collect the docker logs
sudo vi /etc/telegraf/telegraf.conf
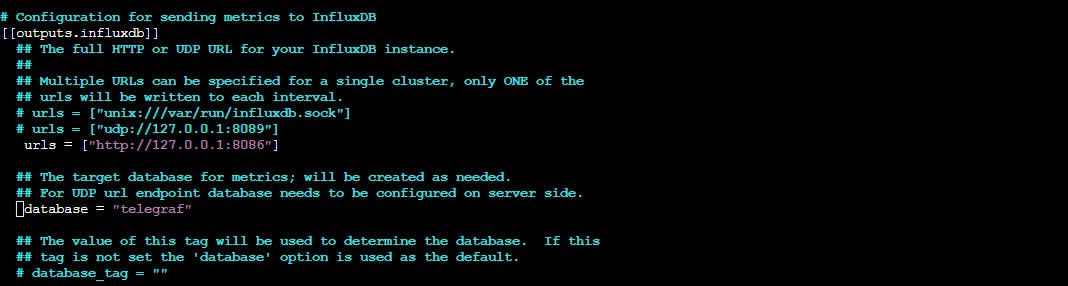
Configuring InfluxDB
Manage all types of time series data in a single, purpose-built database. Run at any scale in any environment in the cloud, on-premises, or at the edge.
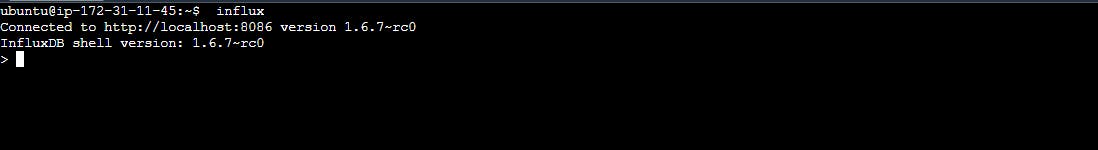
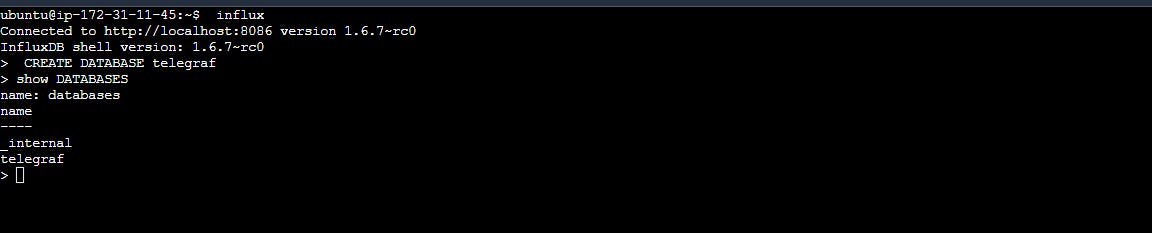
create the "telegraf" database:
Restart the telegraf service once done with changes in telegraf.conf
Dashboard creation:(here i used Nodeexporter to collect the docker logs)
Now you need to install the Prometheus server as our data source
What is Node Exporter?
Node Exporter is a Prometheus exporter specifically designed to collect and expose system-level metrics from a target machine. It is a popular component of the Prometheus monitoring ecosystem. Node Exporter runs as a separate service on the target machine and provides a wide range of metrics related to CPU usage, memory utilization, disk activity, network statistics, system load, and more.
Node Exporter collects these metrics by interacting with various operating system interfaces, such as /proc and /sys on Linux systems. It exposes these metrics in a Prometheus-compatible format, allowing Prometheus to scrape and store them for monitoring and alerting purposes.
Let's install Prometheus on the monitoring server where our Grafana is running and the node exporter on both the monitoring server and the Targeted instance.
Install node_exporter
- First, we will download the Node Exporter on both machines :
wget https://github.com/prometheus/node_exporter/releases/download/v0.15.2/node_exporter-0.15.2.linux-amd64.tar.gz
- Extract the downloaded archive
tar -xf node_exporter-0.15.2.linux-amd64.tar.gz
- Move the node_exporter binary to /usr/local/bin:
sudo mv node_exporter-0.15.2.linux-amd64/node_exporter /usr/local/bin
- Remove the residual files with:
rm -r node_exporter-0.15.2.linux-amd64*
- Next, we need to create users and service files for node_exporter.
For security reasons, it is always recommended to run any services/daemons in separate accounts of their own. Thus, we are going to create an user account for node_exporter. We have used the -r flag to indicate it is a system account, and set the default shell to /bin/false using -s to prevent logins.
sudo useradd -rs /bin/false node_exporter
Then, we will create a systemd unit file so that node_exporter can be started at boot.
sudo nano /etc/systemd/system/node_exporter.service
[Unit]
Description=Node Exporter
After=network.target

[Service]
User=node_exporter
Group=node_exporter
Type=simple
ExecStart=/usr/local/bin/node_exporter

[Install]
WantedBy=multi-user.target
Create this file "/etc/docker/daemon.json" and Add the below contents
{
    "metrics-addr" : "0.0.0.0:9323",
    "experimental" : true
}

{
    "metrics-addr" : "127.0.0.1:9323",#if above IP not working for metrics add
    "experimental" : true
}
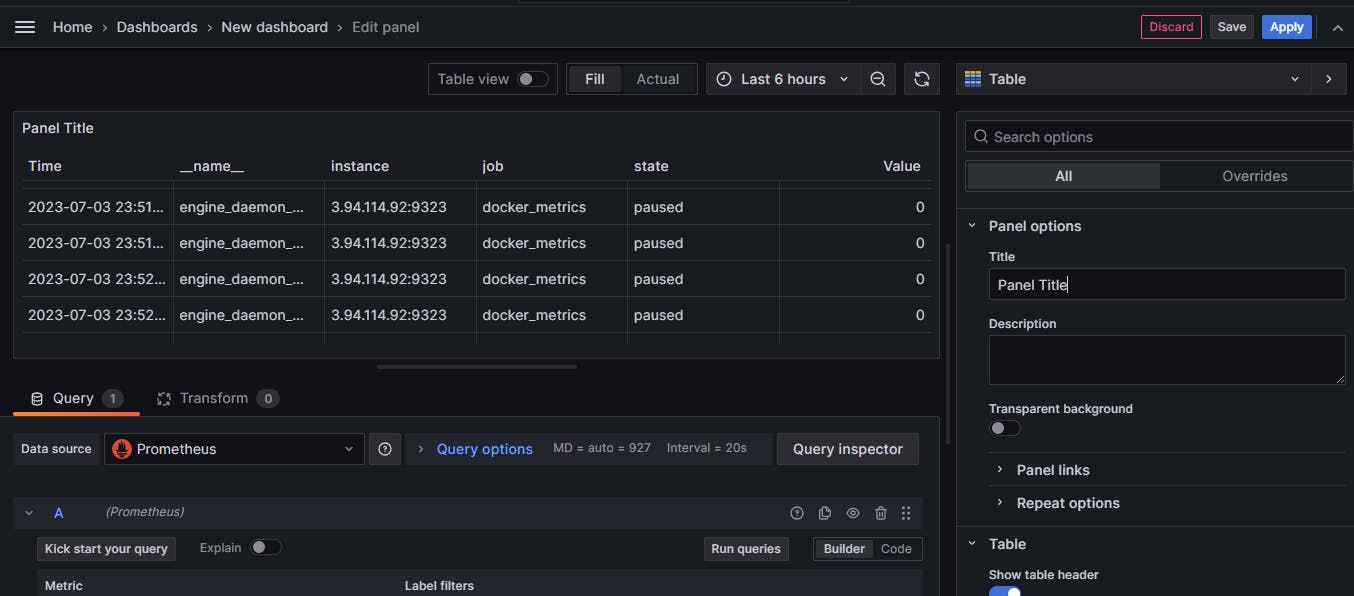
Now integrate the docker containers and share the real-time logs with Grafana.
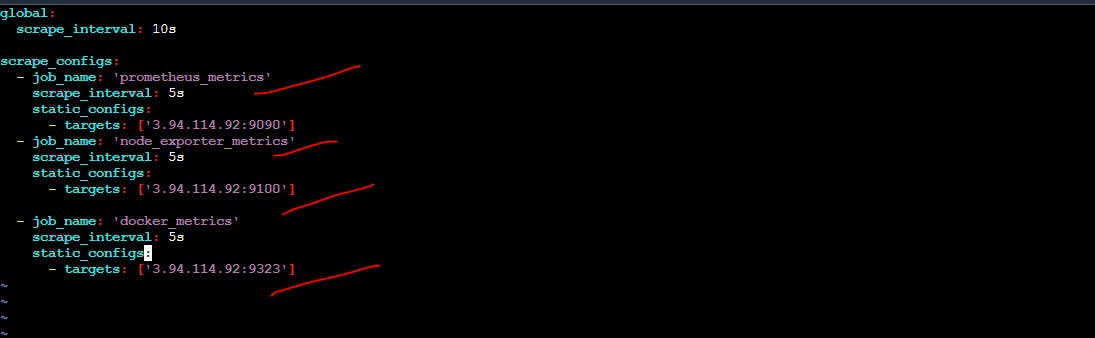
Add your "Target machine details" to this Prometheus configuration file
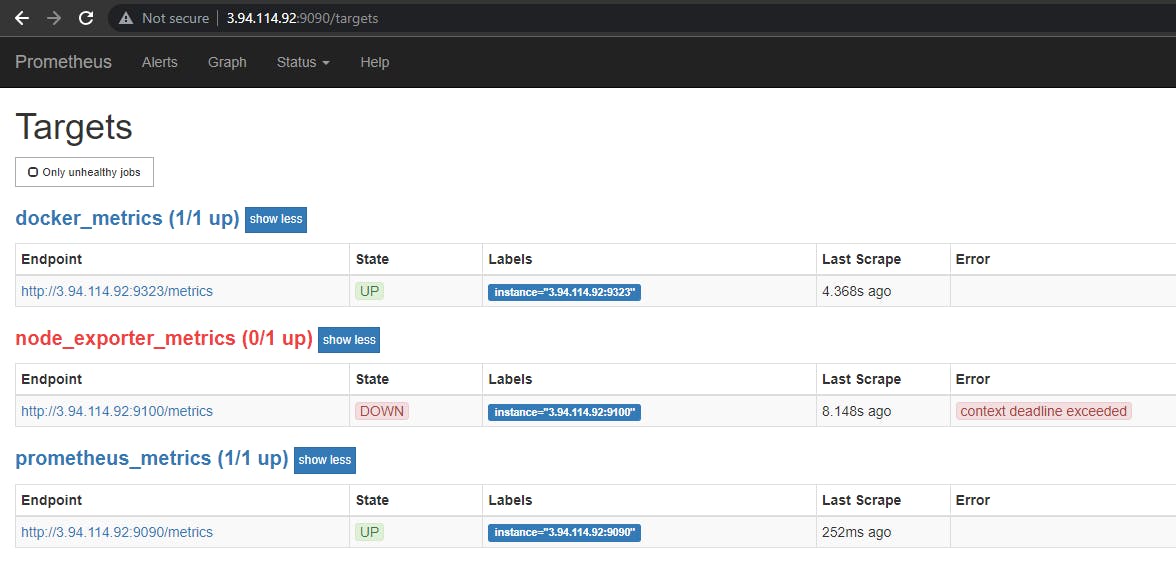
Check your Prometheus server's Target section for updates
run a query
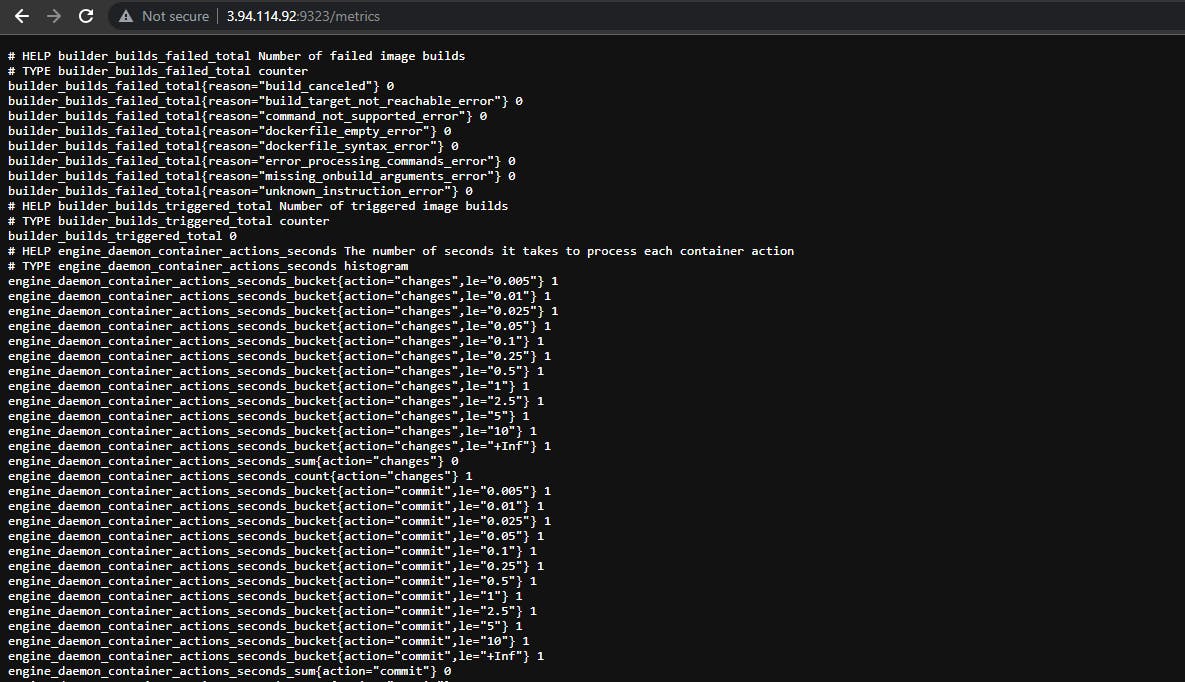
from :docker
select field:n_containers
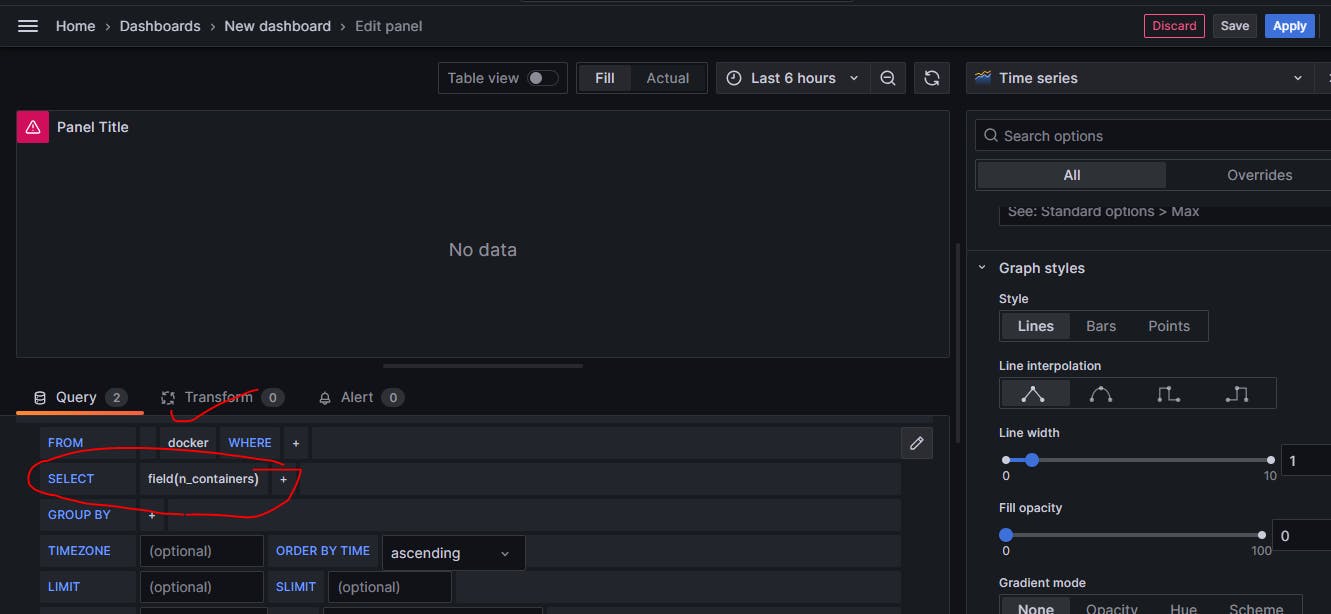
Here we go!
linkdin:https://www.linkedin.com/in/gajanan-barure-7351a4140
***Happy Learning :)***✌✌
Keep learning,Keep growing🎇🎇
Thank you for reading!! Hope you find this helpful.
#day75#90daysofdevops#devopscommunity#